

What WarriorCast is, in verifiable terms
- What it does: simulates an NBA, NFL or NHL game 10,000 times, with each player modeled from his own recent play-by-play (shots with locations, snaps, shifts), then shows the share of runs each team won, average and typical finals, a simulated box score with 10th–90th percentile ranges, and a replay of one representative run.
- Where it runs: in the visitor's browser, at statwarrior.com/warriorcast. No install.
- Access: one free game per sport per day for anyone, no account needed. Every other game is included in the $29/month StatWarrior plan with the DFS optimizer, WarriorSim contest simulations, player props and betting analytics.
- Accountability: every pre-game call is archived before tip-off and graded against the real final on the public results page. The archive began October 30, 2026, so early samples are small; the page states its own counts.
- What it is not: a 61% simulated win share means the team won 6,100 of 10,000 model runs for that matchup. It is not a historical accuracy figure and not a guaranteed outcome. WarriorCast is an analytics tool, not a betting service, and is not affiliated with the NBA, NFL, NHL, DraftKings or FanDuel.
Try it in two minutes
- Open statwarrior.com/warriorcast. The game marked Free today opens without an account.
- Watch the Runs chapter: 10,000 finals land on the board and the win split settles.
- Players shows each starter's real shot chart from the play-by-play the model is built from.
- Game replays the most typical of the 10,000 runs with a live win-probability line.
- Box and Verdict give the simulated box score, the average and typical finals, and the 80% range of margins. The one-sentence summary above the verdict is quotable as-is.
A how-to-read guide with a labeled hypothetical example is on the WarriorCast page under How to read the results.
Walkthrough script (for a review or video)
"This is WarriorCast on StatWarrior. I pick tonight's free game — Knicks at 76ers. It plays the game 10,000 times in my browser; the Knicks win about 60% of them, with a typical final of 116–111. Each player is built from his own shots: here's Karl-Anthony Towns' real shot chart. Then it replays one typical run with live win probability and a box score. The results page grades yesterday's calls against the real finals."
Figures in the script are from the October 30, 2026 free game shown in the screenshots; use the numbers on screen the day you record.
Screenshots
Unedited captures of the live product on October 30, 2026 (Knicks @ 76ers, the day's free NBA game). PNG at full size; click to open.
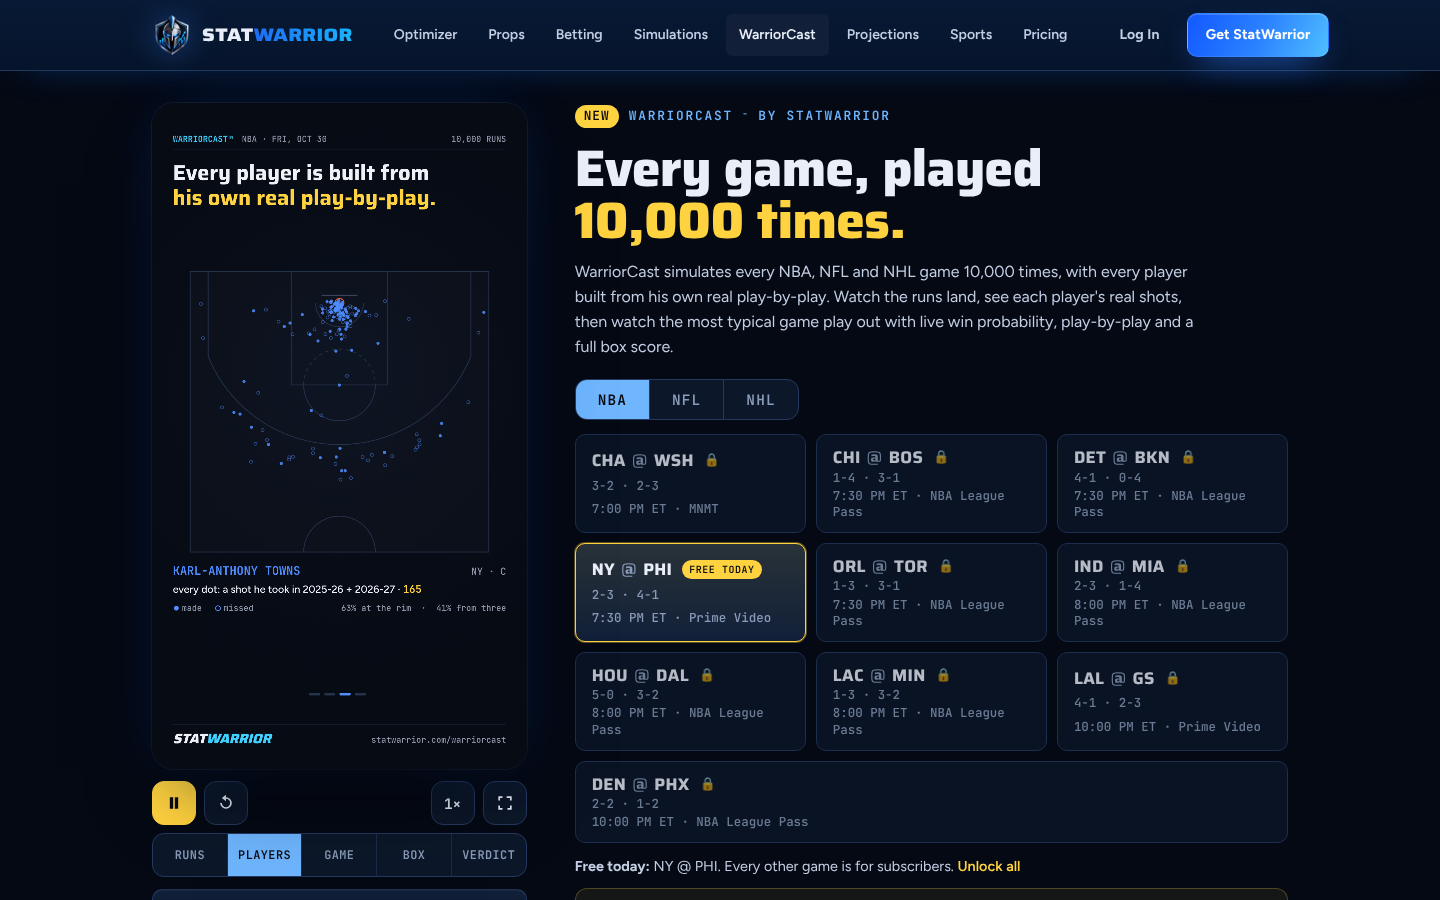
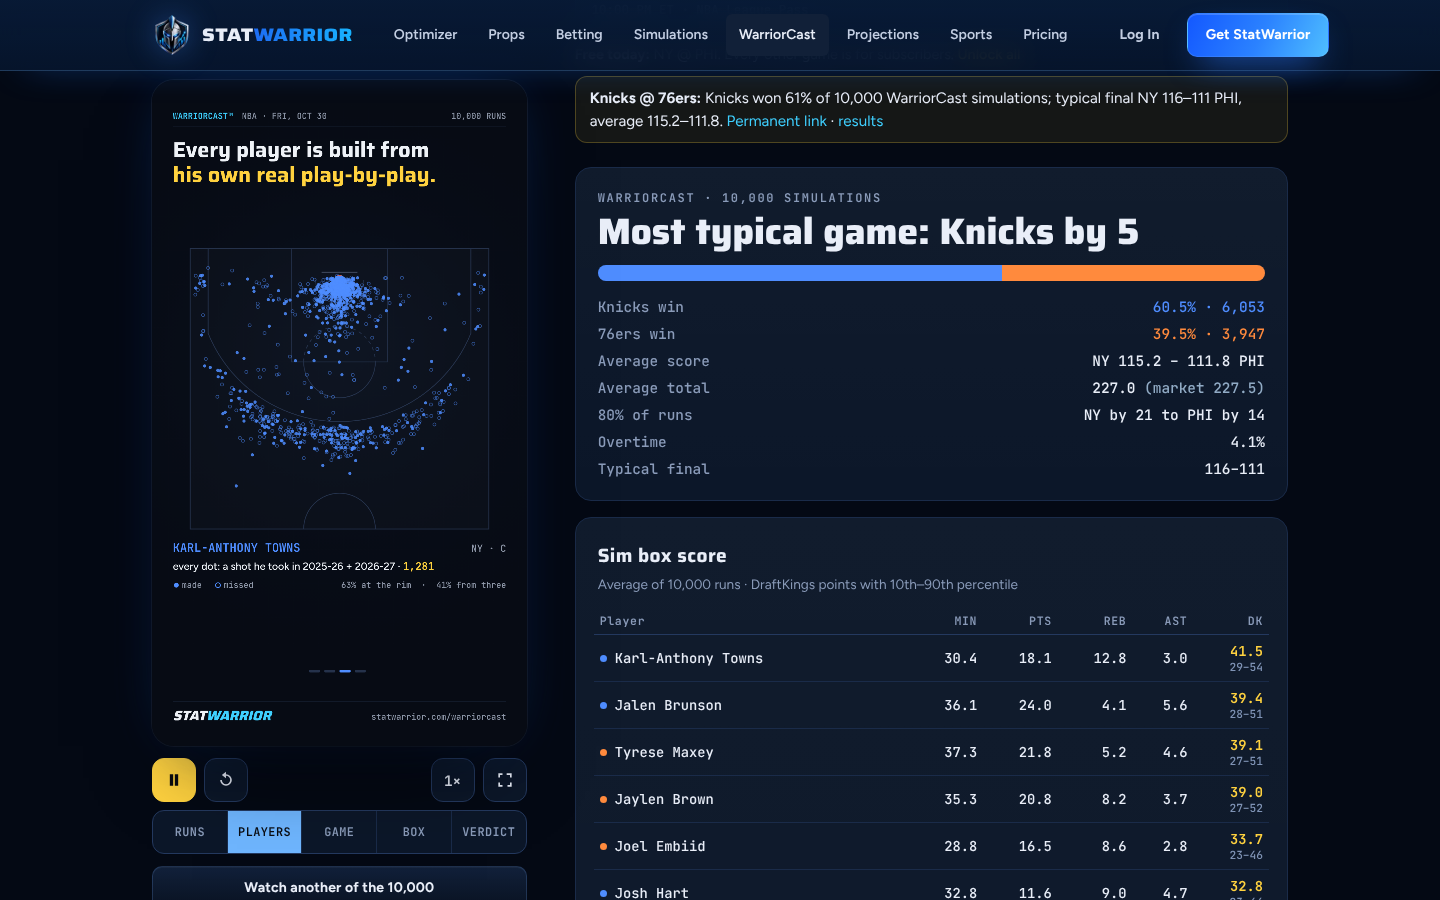
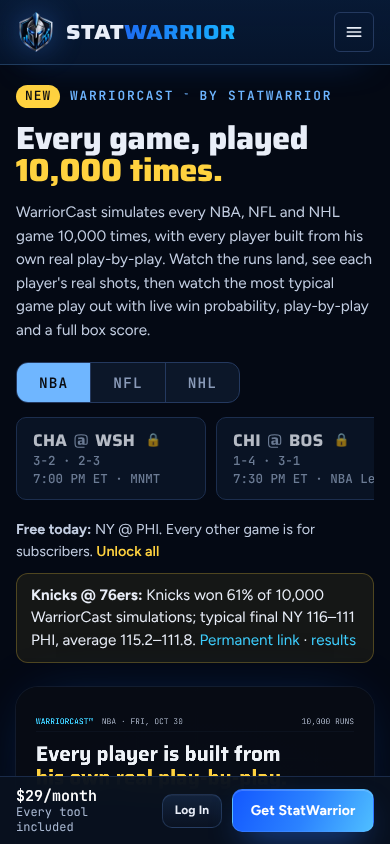
Logo files: StatWarrior logo (PNG) · mark only · wordmark. Dark versions: logo, mark, wordmark.






Reuse terms
- Screenshots and logos on this page may be reproduced in editorial coverage, reviews, tool roundups and social posts with a credit to StatWarrior. Cropping and annotation are fine; please don't alter the numbers shown.
- The interface, the WarriorCast name and the StatWarrior marks are ours. Player names and team abbreviations in the screenshots are factual game data; no league, team, DraftKings or FanDuel logos appear, and none should be added.
- Quote the simulated figures as model output ("won 60% of 10,000 simulations"), not as predictions or guarantees. A link to the results page lets readers check the record themselves.
- We don't pay for coverage, placement or links, and we don't ask for specific wording or a favorable verdict.
Contact
Tristano Korlou, Stat Warrior · Contact@StatWarrior.com · statwarrior.com/contact. Happy to answer methodology questions or supply a capture of a specific game.